Background
Pollinator decline is among the world’s most pressing environmental issues. The creatures that fill this niche are necessary for the reproduction of roughly 85% of flowering plant species, and about three-fourths of the world’s staple crop species rely on them (US Forest Service). The services that pollinators provide in the US agricultural system were valued at $34 billion in 2012 (Jordan et al. 2021). That staggering figure doesn’t even include the value of the many ecosystems that hinge on their presence. Unfortunately, pollinator populations are declining world wide at alarming rates (Potts et al. 2010). Honeybees have become the poster child of this issue—and while the attention is well-deserved, the US is home to around 4000 native bee species, many of which are also facing population declines and are also highly important pollinators (US Forest Service). 49 of these species are members of the genus Bombus, commonly known as bumblebees. In addition to their general efficacy as pollen carriers, bumblebees are the sole pollinators of certain plants they have coevolved with. Flowers of plants like blueberries, tomatoes, pumpkins, and many others require what’s known as buzz pollination, or sonication—this means they need a bee to vibrate at a particular frequency to release their pollen (Vallejo-Marín 2019). Bombus species perform this form of pollination, making them invaluable to our native ecosystems and many important food crops.
Interestingly, some studies have shown evidence that managed honeybees, which are nonnative, may be outcompeting native bees for resources (Angelella, McCullough, and O’Rourke 2021)(Mallinger, Gaines-Day, and Gratton 2017). It’s crucial that we understand everything that might be contributing to the decline of native bee species. The question this analysis investigates is: how does the number of managed honeybee colonies effect bumblebee occurrence in US counties?
Data
The analysis uses two different datasets—one containing managed honeybee colonies and the other bumblebee occurrence.
The honeybee data are originally from the USDA, and were tidied and made available on data.world by Brenda Grifith. The full dataset can be found here: https://data.world/siyeh/us-bee-stats-by-state/workspace/file?filename=Bee+Colony+Census+Data+by+County.csv. It contains the number of managed honeybee hives reported to the USDA Census of Agriculture per US county, in 2002, 2007, and 2012.
The bumblebee data, referred to as USBombus, are the result of a systematic nationwide survey of Bombus populations conducted for a 2011 study by Cameron et al. to determine the extent of bumblebee decline in the US. The dataset can be found here: https://www.gbif.org/dataset/c4a2c617-91a7-4d4f-90dd-a78b899f8545#temporalCoverages. It contains observations of bumblebee occurrence from sites in 40 of the contiguous states throughout a range of habitats and elevations, and includes coordinates associated with each observation. Specimens were captured on flowers and in flight using sweep nets. The survey took place between 2007 and 2010.
Methods
I chose to compare variations in honeybee colonies and bumblebee occurrence by location because the bumblebee data were collected over a number of years with little to no overlap in survey sites—thus, they don’t allow us to observe variation over time.
Because insect population densities can vary over small spatial ranges, I wanted to compare honeybee colonies and bumblebee occurrence at the finest resolution possible. In this case, the honeybee colony dataset limits us to the county level.
Dataset Approaches
In order to capture estimates of the number of managed honeybee colonies in the years surrounding the bumblebee survey, I calculated the mean number of colonies reported for each county from agriculture census years 2002, 2007, and 2012. Data from states that weren’t surveyed in USBombus were removed.
Despite being one of the most extensive US bee surveys available, the USBombus data only represent occurrence in certain parts of certain counties. In order to estimate a more complete picture of bumblebee occurrence at the county level throughout much of the country, I chose to interpolate bumblebee occurrence using the survey data. Based on its spatial dispersion, the dataset appears to be a good candidate for this approach. I used ordinary Kriging, which several studies have successfully employed to predict insect occurrence (Pasini et al. 2021)(Zhang et al. 2007)(Zhou et al. 2012). To simplify the interpolation process, I limited the analysis to only counties within the conterminous US.
Interpolation
After summing the occurrence counts at each unique latitude and longitude in the bumblebee dataset, I used the autofitVariogram function in the automap package to create a fitted variogram model. I then created a grid with the spatial bounds of the bumblebee dataset composed of 0.4° x 0.4° cells. Using the krige() function in the gstats package I interpolated values of bumblebee occurrence onto the grid based on the variogram model. In order to derive a single estimated value of bumblebee occurrence in each county, I joined the interpolated output with a US counties dataset, and calculated the mean predicted occurrence in each county. I subsetted the resulting data to only states that were surveyed and only counties for which honeybee data were available by performing an inner join with the honeybee dataset. The interpolated mean bumblebee occurrence data are visualized below.
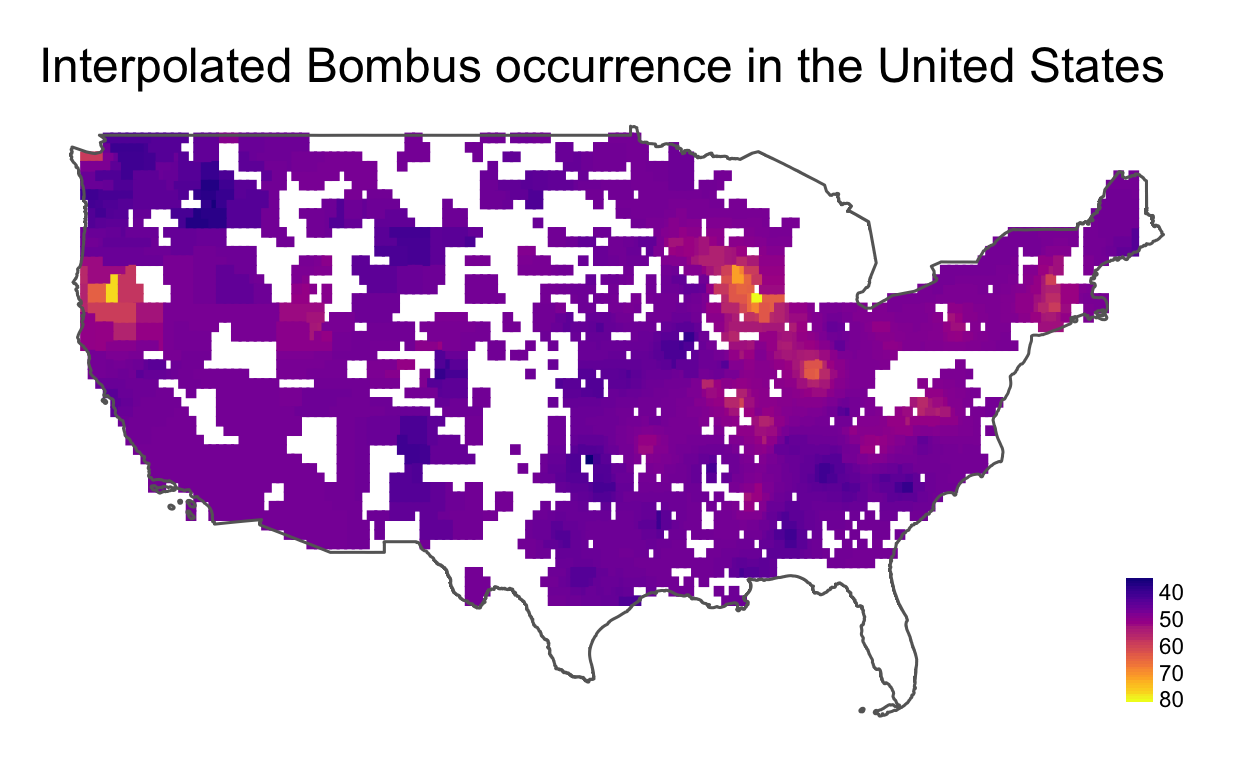
Figure 1: This map represents mean bumblebee occurence by county based on spatial interpolation of the USBombus dataset. Only counties represented in the analysis are included.
Regression
I now have estimated values of bumblebee occurrence and managed honeybee colonies for all represented counties. After plotting the distributions of both sets of values, I determined that mean bumblebee occurrence appear to be normally distributed, and mean honeybee colonies appear to be log-normally distributed. I then regressed mean estimated bumblebee occurrence on mean honeybee colonies using ordinary least squares—the resulting visualization and summary table are below.
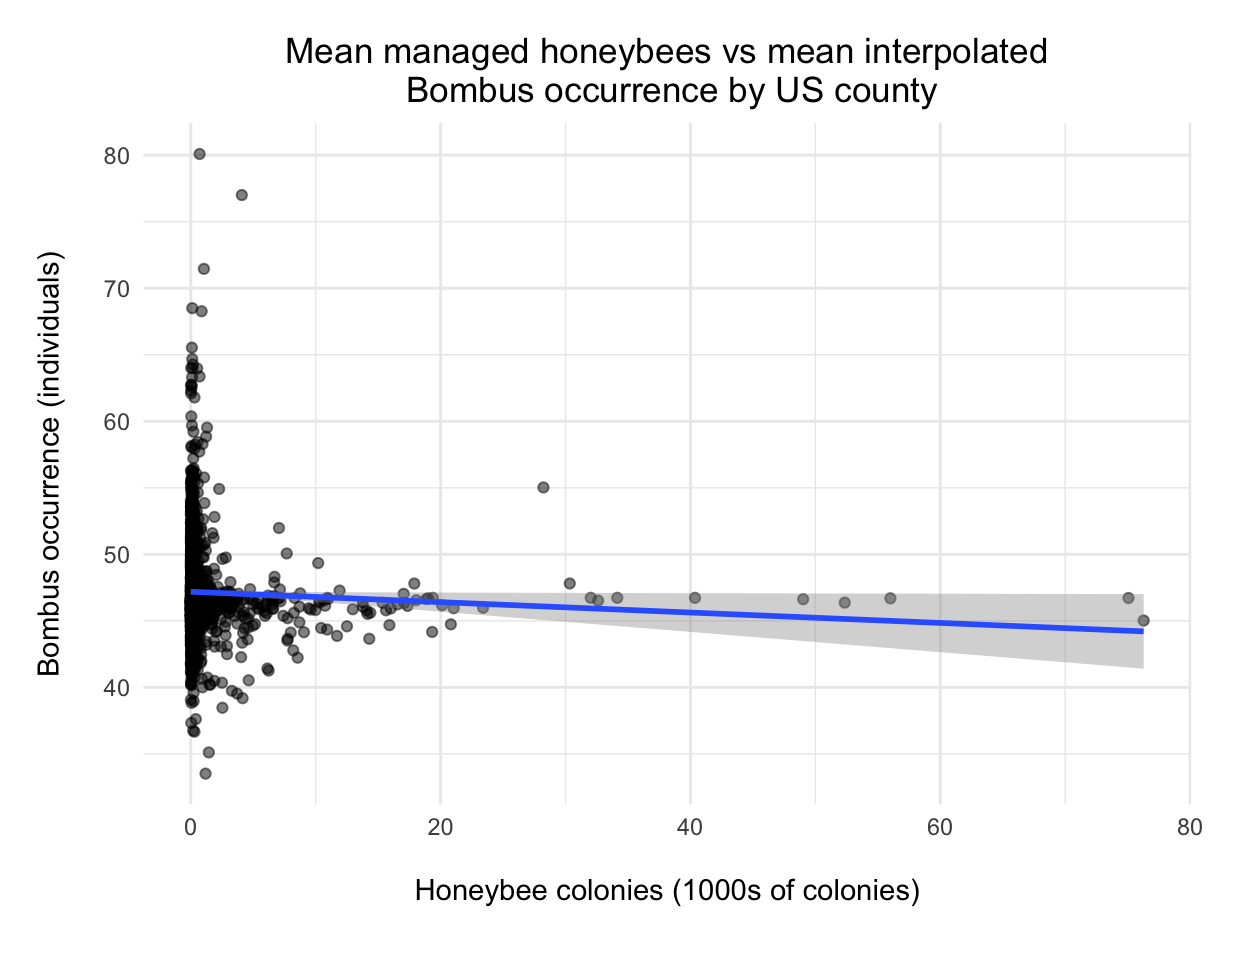
Figure 2: This scatterplot compares the mean number of managed honeybee hives per US county from agriculture census years 2002, 2007, and 2012 vs mean bumblebee occurrence per county derived from spatial interpolation of a national bee survey conducted between 2007 and 2010.
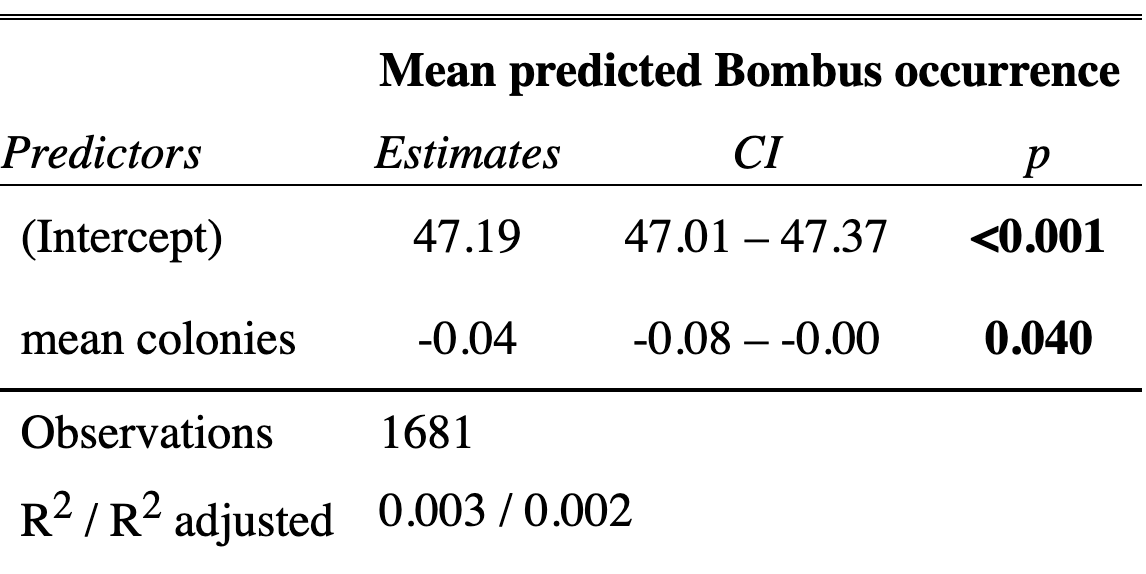
Figure 3: This table presents the results of a simple linear regression of mean honeybee colonies per county on mean interpolated bumblebee occurrence per county.
Interpreting results
The regression reveals a slight negative correlation. The correlation is statistically significant at a level of less than \(0.05\) and thus we can reject the null hypothesis that there is no relationship between the two samples. According to the model coefficients, a county with no managed honeybee colonies has a mean bumblebee occurrence of \(47.19\) individuals, and an increase of \(1000\) managed honeybee colonies results in a decrease of 0.04 individuals in mean bumblebee occurrence. The \(R^2\) value tells us that about \(0.2\)% of the variation in the interpolated mean bumblebee occurrence during the national survey is explained by mean managed honeybee colonies in 2002, 2007, and 2012.
In assessing our OLS assumptions, nothing in this analysis overtly suggests that assumption 1 (the population relationship is linear in parameters with an additive disturbance) or 2 (\(x\) variable is exogenous) are being violated. Additionally, we know that \(x\) has variation, satisfying assumption 3. Assumption 4, on the other hand, does not appear to be satisfied. The mean of the residuals is very close to \(0\), but looking at the residuals plotted against mean honeybee colonies reveals a higher variance in residuals close to \(0\) compared with that of greater values. The coefficient estimates may be unbiased, but the lowest variance property of OLS may not be upheld.
Analysis limitations
While this analysis yielded a statistically significant result, there are some potential issues with the data and methods that need to be taken into consideration.
The large spatial scale of the analysis raises some possible concerns. The first of which being that the US is composed of widely different biomes with naturally varied concentrations of bumblebee species—a smaller geographic scope with more consistent habitat may provide better insight into this possible relationship by reducing the ambient variation in occurrence. Additionally, while I did find instances of ordinary Kriging being used to interpolate insect occurrence, I wasn’t able to find instances that reflected the scale used in my analysis. This warrants further investigation to better understand the limitations of ordinary Kriging as a tool for estimating insect occurrence.
Another possible complicating factor is the likelihood that most managed honeybee hives are located on private property, and many bumblebee survey sites tend to be on public lands. It’s possible that the foraging ranges of a large number of managed honeybee hives may not overlap at all with the bumblebee populations that were surveyed.
The time gaps in the honeybee data are also of concern. The Census of Agriculture only takes place every five years, and the number of honeybee colonies managed by a farming operation can vary greatly year to year—especially as of recently, due to Colony Collapse Disorder, varroa mite infestation, and pesticide use.
Conclusions and further analysis
Because of the analysis limitations, use of interpolated data, and the low coefficient of determination, I don’t think that this analysis is grounds to assert that managed honeybee colonies are having a broad-scale negative impact on bumblebee populations—I do, however, think that it warrants further investigation and experimental data collection.
These are rich datasets and there’s certainly much more to be gleaned from comparing them. To continue this investigation using the same data, I would try comparing honeybee and bumblebee estimates from similar ecoregions, in addition to exploring possible impacts on individual Bombus species. I would also like to explore other interpolation methods, such as the various forms of kriging discussed by Sciarretta and Trematerra in their 2014 analysis of geostatistical tools for studying insect spatial distribution. Given access to the relevant data, I would like to look at consistently surveyed bumblebee occurrence and managed hives within a relatively homogenous ecosystem, and to observe the relationship between their trends over time.
Regardless of how it’s done, we need to do everything we can to understand the threats facing our native pollinators in order to mitigate their decline, and to preserve the invaluable services they provide.
References
Alex Jordan et al., “Economic Dependence and Vulnerability of United States Agricultural Sector on Insect-Mediated Pollination Service,” Environmental Science & Technology 55, no. 4 (February 16, 2021): 2243–53, https://doi.org/10.1021/acs.est.0c04786
“Animal Pollination,” accessed December 1, 2021, https://www.fs.fed.us/wildflowers/pollinators/animals/index.shtml; “Bee Pollination,” accessed December 1, 2021, https://www.fs.fed.us/wildflowers/pollinators/animals/bees.shtml
“Bee Colony Statistics - Dataset by Siyeh,” data.world, accessed November 25, 2021, https://data.world/siyeh/us-bee-stats-by-state; A. Sciarretta and P. Trematerra
Fabrice Vinatier et al., “Factors and Mechanisms Explaining Spatial Heterogeneity: A Review of Methods for Insect Populations: Factors and Mechanisms Explaining Spatial Heterogeneity,” Methods in Ecology and Evolution 2, no. 1 (January 2011): 11–22, https://doi.org/10.1111/j.2041-210X.2010.00059.x
“Geostatistical Tools for the Study of Insect Spatial Distribution: Practical Implications in the Integrated Management of Orchard and Vineyard Pests,” Plant Protection Science 50, no. No. 2 (May 6, 2014): 97–110, https://doi.org/10.17221/40/2013-PPS
G. M. Angelella, C. T. McCullough, and M. E. O’Rourke, “Honey Bee Hives Decrease Wild Bee Abundance, Species Richness, and Fruit Count on Farms Regardless of Wildflower Strips,” Scientific Reports 11, no. 1 (February 5, 2021): 3202, https://doi.org/10.1038/s41598-021-81967-1
Jonathan B. Koch, “USBombus, Contemporary Survey Data of North American Bumble Bees (Hymenoptera, Apidae, Bombus) Distributed in the United States,” accessed November 25, 2021, https://doi.org/10.15468/g8cnke
Mario Vallejo-Marín, “Buzz Pollination: Studying Bee Vibrations on Flowers,” New Phytologist 224, no. 3 (2019): 1068–74, https://doi.org/10.1111/nph.15666
Mauricio Paulo Batistella Pasini et al., “Semivariogram Models for Rice Stem Bug Population Densities Estimated by Ordinary Kriging,” Acta Scientiarum. Agronomy 43 (2021), https://www.redalyc.org/journal/3030/303067924025/html/
Simon G. Potts et al., “Global Pollinator Declines: Trends, Impacts and Drivers,” Trends in Ecology & Evolution 25, no. 6 (June 1, 2010): 345–53, https://doi.org/10.1016/j.tree.2010.01.007./
Rong Zhang et al., “[Spatial structure analysis and distribution simulation of Therioaphis trifolii population based on geostatistics and GIS],” Ying Yong Sheng Tai Xue Bao = The Journal of Applied Ecology 18, no. 11 (November 2007): 2580–85
Rachel E. Mallinger, Hannah R. Gaines-Day, and Claudio Gratton, “Do Managed Bees Have Negative Effects on Wild Bees?: A Systematic Review of the Literature,” PLOS ONE 12, no. 12 (December 8, 2017): e0189268, https://doi.org/10.1371/journal.pone.0189268.
S. A. Cameron et al., “Patterns of Widespread Decline in North American Bumble Bees,” Proceedings of the National Academy of Sciences 108, no. 2 (January 11, 2011): 662–67, https://doi.org/10.1073/pnas.1014743108
Wei Zhou et al., “Analysis of Spatial Pattern among Grasshopper and Vegetation in Heihe Based on GIS,” Physics Procedia 33 (2012): 1261–68, https://doi.org/10.1016/j.phpro.2012.05.208